Austin Meyer, MD, PhD, MS, MPH, MS, FACP, FAAP
Baylor Scott & White Health
Baylor College of Medicine
Using surveillance and forecasting to optimize flu vaccine timing
UT Austin, Internal Medicine Grand Rounds
Disclosure

The following speakers and planners do not have relevant financial relationship(s) with ineligible companies to disclose:
The following speakers and planners have relevant financial relationship(s) with ineligible companies to disclose:
PlannersNoneSpeakersNone
Three questions for today
1What does flu surveillance data look like?
2How do we forecast the flu and how far ahead is it useful?
3When should patients get their flu vaccine?
The goal of respiratory virus surveillance is to use epidemic information to improve health
Simulated national influenza season
Jun 1, 20261.2% ILI
Aug 3, 20261.0% ILI
Sep 1, 20261.2% ILI
Nov 16, 20261.8% ILI
Nov 19, 20261.8% ILI
Nov 29, 20262.5% ILI
Dec 3, 20262.9% ILI
Dec 10, 20263.5% ILI
Dec 21, 20264.7% ILI
Jan 20, 20277.0% ILI
Jan 27, 20276.6% ILI
Feb 19, 20274.5% ILI
Mar 1, 20273.4% ILI
May 31, 20271.1% ILI
Below onset
Epidemic underway
Declining after peak
What surveillance shows Summer baseline The curve is quiet; preparation for the coming season starts before the epidemic signal appears.
Vaccine decision · Aug 3 Vaccine distribution begins Begin distributing vaccine to administration sites about four months before season onset.
Vaccine decision · Sep 1 Vaccination campaign starts Start the vaccination campaign before incidence begins rising to capture as many people as possible at outpatient points of care.
Vaccine decision · Nov 16 Target maximum uptake Aim to reach maximum vaccine uptake before the surveillance onset threshold is crossed.
Clinical operation · Nov 19 Stage antivirals at clinics Confirm antiviral supply and distribute stock to outpatient and acute-care sites.
Clinical operation · Nov 29 Adjust influenza pre-test probability As community influenza activity rises, update the pre-test probability used to interpret influenza testing results and guide empiric treatment decisions.
Surveillance milestone · Dec 3 Onset threshold crossed The national curve exceeds the surveillance onset threshold.
Public health guidance · Dec 10 Intensify prevention guidance Reinforce hand hygiene, staying home when ill, and masks or distance in crowded indoor spaces.
Clinical operation · Dec 21 Shift clinical resources Redistribute staffing, diagnostics, pharmaceuticals, and equipment toward regions experiencing the greatest burden.
Public health guidance · Jan 20 Peak: sustain interventions Communicate that activity is near its peak, and ask the public and health systems to sustain effective interventions.
Vaccine decision · Jan 27 Preliminary VE available Early vaccine-effectiveness estimates become available after most vaccination-timing decisions are already complete.
Vaccine decision · Feb 19 Select next season’s strains Select the Northern Hemisphere vaccine strains for the next influenza season.
Vaccine decision · Mar 1 Vaccine manufacturing begins Manufacturing for the next Northern Hemisphere season begins after U.S. strain selection in late February or early March.
Vaccine
Clinical
Public health
Surveillance
Decisions depend on the state of the epidemic, but what do we actually observe?
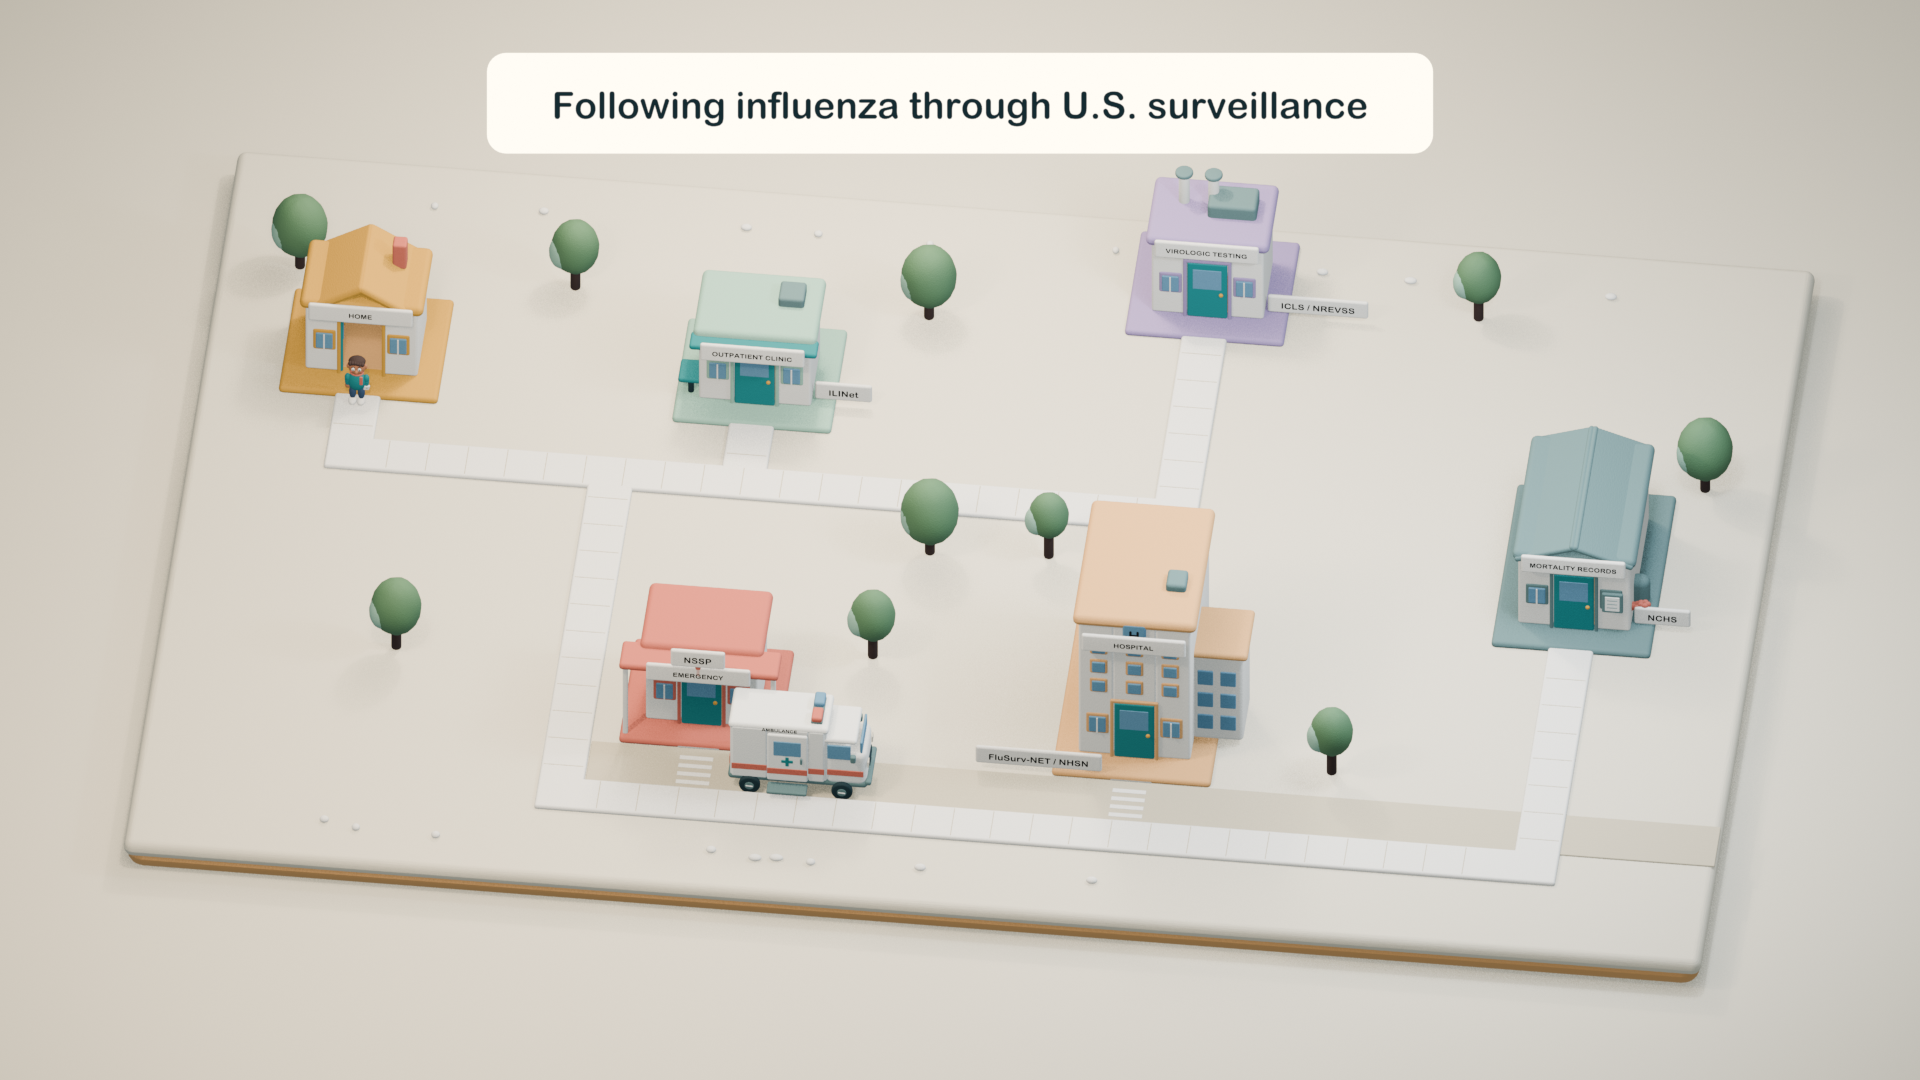
US influenza surveillance combines signals from different parts of the healthcare system
Surveillance along the patient journey
Patient journey
Specimen / laboratory signal

Symptomatic
illness
illness
Outpatient
clinic
clinic

ILINet
Virologic
testing
testing

ICLS
NREVSS
Emergency
department
department

NSSP
Hospital
admission
admission

FluSurv-NET
NHSN
Mortality

NCHS
Pediatric deaths
Complementary signals
Outpatient and Emergency Care
Inpatient surveillance
Virologic surveillance
Mortality surveillance
Different systems answer different questions Illness, hospital care, laboratory testing, and deaths
Outpatient and Emergency Care ILINet · NSSP
Inpatient surveillance FluSurv-NET · NHSN
Virologic surveillance ICLS · NREVSS
Mortality surveillance NCHS · Pediatric deaths
Reports Outpatient and emergency visits, hospital admissions, laboratory results, and deaths.
Reports ILINet tracks visits for flu-like symptoms. NSSP tracks emergency visits with a flu diagnosis.
Reports FluSurv-NET tracks hospitalization rates and patient characteristics in selected communities. NHSN tracks admissions, occupied beds, and hospital capacity nationwide.
Reports ICLS focuses on influenza; NREVSS also tracks other respiratory and enteric viruses. Clinical and public-health labs report through these networks.
Reports NCHS tracks death-certificate diagnoses. Pediatric surveillance records individual confirmed flu deaths in children.
How to read it Use the signals together to follow flu activity and its impact on care. Each system measures a different event, so compare trends within each system.
How to read it Use them to follow demand for outpatient and emergency care. ILINet counts flu-like symptoms from any cause; NSSP counts visits diagnosed as flu.
How to read it Use FluSurv-NET rates to see who is hospitalized and NHSN counts to gauge pressure on hospitals. Both count patients admitted with a positive flu test.
How to read it Use clinical-lab positivity to follow flu activity among tested patients, and public-health results to see which flu viruses are circulating.
How to read it Use them to follow flu's fatal impact and who is affected. Deaths follow illness, and each week's figures update as reports arrive.
Outpatient and Emergency Care · Outpatient clinic
ILINet U.S. Outpatient Influenza-like Illness Surveillance Network
Reports The weekly percentage of outpatient visits meeting the influenza-like illness definition, reported by age group.
How to read it Use it to follow when flu-like illness rises, peaks, and falls in outpatient clinics. It counts visits for fever with cough or sore throat, whatever the cause.
CDC surveillance methods ↗Virologic surveillance · Influenza-focused network
ICLS U.S. Influenza Collaborating Laboratories System
Reports Weekly influenza tests and positive results. Public-health laboratories also report virus types, subtypes, lineages, and patient ages.
How to read it Use clinical-lab positivity to follow flu activity, and public-health results to see which flu viruses are circulating. Public-health labs identify each virus's type and subtype or lineage.
CDC surveillance methods ↗Virologic surveillance · Multiple-virus network
NREVSS National Respiratory and Enteric Virus Surveillance System
Reports Weekly test totals and positive results for influenza and other respiratory and enteric viruses, from hospital, commercial, and public-health laboratories.
How to read it Use clinical-lab positivity to follow when and where flu is circulating. Positivity is the share of tested specimens that are positive for flu.
CDC surveillance methods ↗Outpatient and Emergency Care · Emergency department
NSSP National Syndromic Surveillance Program
Reports The percentage of emergency-department visits with an influenza discharge diagnosis, overall and by age group.
How to read it Use it to follow flu trends in emergency departments, nationally and by state. A visit counts when its discharge diagnosis is influenza (ICD-10 J09–J11).
CDC surveillance methods ↗Inpatient surveillance · Hospital admission
FluSurv-NET Influenza Hospitalization Surveillance Network
Reports Population-based weekly rates and detailed characteristics of laboratory-confirmed influenza hospitalizations in selected catchment areas.
How to read it Use it to compare hospitalization rates across ages and seasons and see who is most affected. Rates come from residents of more than 90 counties in 14 states.
CDC surveillance methods ↗Inpatient surveillance · Hospital admission
NHSN National Healthcare Safety Network Hospital Respiratory Data Module
Reports Weekly facility-level counts of new laboratory-confirmed influenza admissions, current hospitalizations, ICU occupancy, and bed capacity.
How to read it Use it to track flu admissions and pressure on hospital and ICU beds, nationally and by state. Acute-care and critical-access hospitals are required to report weekly.
CDC surveillance methods ↗Mortality surveillance · Death certificates
NCHS National Center for Health Statistics Mortality Surveillance
Reports Weekly death-certificate measures for deaths coded with influenza, pneumonia, and/or COVID-19.
How to read it Use flu-coded deaths to follow flu's fatal impact over the season. Each week's figures update as death certificates arrive.
CDC surveillance methods ↗Mortality surveillance · Notifiable death
Pediatric deaths Influenza-Associated Pediatric Mortality Surveillance System
Reports Individual laboratory-confirmed influenza-associated deaths among people younger than 18 years, with demographic and clinical details.
How to read it Use it to track flu deaths in children, with each child's age, vaccination status, and underlying conditions. Season totals update as reports arrive.
CDC surveillance methods ↗Each system covers different cohorts and has different biases
Poll question #1
ILINet has measured outpatient influenza-like illness nationwide since 1997/98
Outpatient clinics · ILINet
ILINet
U.S. Outpatient Influenza-like Illness Surveillance Network
Measures
% of outpatient visits for influenza-like illness: fever with cough or sore throat
Coverage
≈4,000 providers in all 50 states
2024/25 · United States
1997/98–2025/26 · United States
2024/25 · 50 states + DC
NSSP grew from a bioterrorism early warning system into national emergency department surveillance
Emergency departments · NSSP
NSSP
National Syndromic Surveillance Program
Measures
% of emergency department visits with a discharge diagnosis of influenza
Coverage
≈85% of U.S. emergency departments
2024/25 · United States
2022/23–2025/26 · United States
2024/25 · 50 states + DC
Flu and RSV joined COVID-19 in NHSN's required weekly count of lab-confirmed hospital admissions
Hospital admissions · NHSN
NHSN
National Healthcare Safety Network
Measures
New admissions with lab‑confirmed influenza per 100,000 people
Coverage
All acute‑care and critical‑access hospitals
2024/25 · United States
2020/21–2025/26 · United States
2024/25 · 50 states + DC
FluSurv-NET has turned hospitalizations into population-based rates since 2003
Hospitalization rates · FluSurv-NET
FluSurv-NET
Influenza Hospitalization Surveillance Network
Measures
Lab‑confirmed influenza hospitalizations per 100,000 residents
Coverage
More than 90 counties in 14 states
2024/25 · all sites combined
2009/10–2025/26 · all sites combined
2024/25 · 9 states
Clinical laboratories report how often tested specimens are positive for flu
Clinical laboratories · ICLS and NREVSS
ICLS · NREVSS
Clinical laboratories reporting through either network
Measures
% of tested specimens positive for influenza
Coverage
≈300 clinical labs in all 50 states
2024/25 · United States
2016/17–2025/26 · United States
2024/25 · 43 states
When does flu season peak?
In each surveillance system,
the "typical" flu season looks different
In each surveillance system,
the "typical" flu season looks different
In each surveillance system,
the "typical" flu season looks different
In each surveillance system,
the "typical" flu season looks different
In each surveillance system,
the "typical" flu season looks different
How do we forecast the flu and
how far ahead is it useful?
Poll question #2
The CDC FluSight project
Many teams contribute to CDC's FluSight project
Models contributing regularly
Submitted forecasts in at least half of scheduled weeks · 2026/27 through Oct 24
23
21
34
43
48
59
2021/22
2022/23
2023/24
2024/25
2025/26
2026/27
Teams submit weekly forecasts
CDC produces a shared ensemble
Individual model forecasts vary widely
Texas · weekly influenza hospital admissions · December 11, 2024
How many admissions should hospitals expect?
Forecasting teams
2024/25: 33 teams, 46 models
FluSight hub
Ensemble forecast
Staffing · Beds · Supplies
The forecasting targets have changed over time
2013/14
Outpatient illness
2021/22
Hospitalizations
The forecasting targets have changed over time
2013/14
Outpatient illness
2021/22
Hospitalizations
2026/27 · Primary target
Weekly hospital admissions
Current week + 3 weeks ahead
The forecasting targets have changed over time
2013/14
Outpatient illness
2021/22
Hospitalizations
2026/27 · Primary target
Weekly hospital admissions
Current week + 3 weeks ahead
Flu ED visits
% of all ED visits
Peak timing
week of the year
Peak height
admission count
Hospitalization trend
5 categories
FluSight forecasts give a median and a range of likely admissions
Weekly laboratory-confirmed influenza hospital admissions
How our team forecasts flu hospitalizations
A new target, too little history
COVID-19 pandemic
Historical ILINet dataset
Sep 2009 – Sep 2020
Nationwide influenza
hospital admissions
hospital admissions
Oct 2020 – Oct 2022
2009
2012
2015
2018
2020
2022
Forecasting begins
2022/23
Incomplete, optional flu reporting from 2020; mandatory from February 2022.
The history was short, and early reporting undercounted admissions
Texas · weekly influenza hospital admissions
Our models moved from statistical to machine learning
Influenza hospitalization forecasting
Forecasts are good at short horizon away from regime change
Texas · MIGHTE-Base without additional covariatesForecast forThis weekForecast for1 week aheadForecast for2 weeks aheadForecast for3 weeks ahead
We are testing other surveillance signals as forecast inputs
Adding surveillance signals
Adding wastewater lags does improve accuracy slightly
Texas · MIGHTE-Base + wastewater lagsForecast forThis weekForecast for1 week aheadForecast for2 weeks aheadForecast for3 weeks ahead
We will post this season’s forecasts and rankings weekly
https://www.meyerlab.io/flusight_2026 https://www.respilens.com
A forecast helps when it is tied to a planned action, such as staffing or resource allocation.
Forecasts are only good at short lead times; unreliable turning points.
Uneven partnerships with public health.
Limited connection and integration into healthcare operations.
Forecasting skill and operational usefulness are different goals
When should patients get their flu vaccine?
Poll question #3
The answer depends strongly on how protection wanes
The best week minimizes the burden left unprotected
Without vaccination, the full seasonal burden remainsAn early dose can wane before the winter peakA late dose leaves earlier illness unprotectedThe smallest shaded area identifies the best week2017/18 U.S. season · one illustrative protection curve
We compare vaccination weeks across
many plausible seasons and waning scenarios
Start with one epidemic and protection curveOne possible epidemic and protection curveThe same comparison across sampled scenariosChoose the week with the lowest average burden1 of 5,000 scenarios shown2 of 5,000 scenarios shown3 of 5,000 scenarios shown4 of 5,000 scenarios shown5 of 5,000 scenarios shown6 of 5,000 scenarios shown7 of 5,000 scenarios shown8 of 5,000 scenarios shown9 of 5,000 scenarios shown10 of 5,000 scenarios shown
After 5000 scenario draws we can predict the optimal week
National · All ages
Timing changes how much protection we lose
A later date only helps if vaccination still happens
Rather than a best fixed week, is there a tool that is flexible to seasonal variation?
A threshold might be useful to identify the best week
Can the same rule adapt to an early season?
How can forecasts improve our vaccine decisions?
This week's forecast is set to cross the vaccination threshold
What to take back to clinical work
1Each surveillance system measures a different step of illness; together they show when flu rises, peaks, and falls.
2Forecasts are most accurate in the near term and away from turning points.
3Our national model favors MMWR week 48 for a single dose; it is likely that a data driven approach is better; when a later visit is uncertain, vaccinate today.
Thanks for your attention

Mauricio Santillana
Northeastern University
Research mentor

Shihao Yang
Georgia Tech

Leo Clemente
Santillana Lab

Fred Lu
Santillana Lab

Candice Djorno
Yang Lab
What questions do you have?
Using surveillance and forecasting to optimize flu vaccine timing
By Austin Meyer